
Burn Rate Alerts for SLOs: Fast and Slow Burn on AWS and GCP
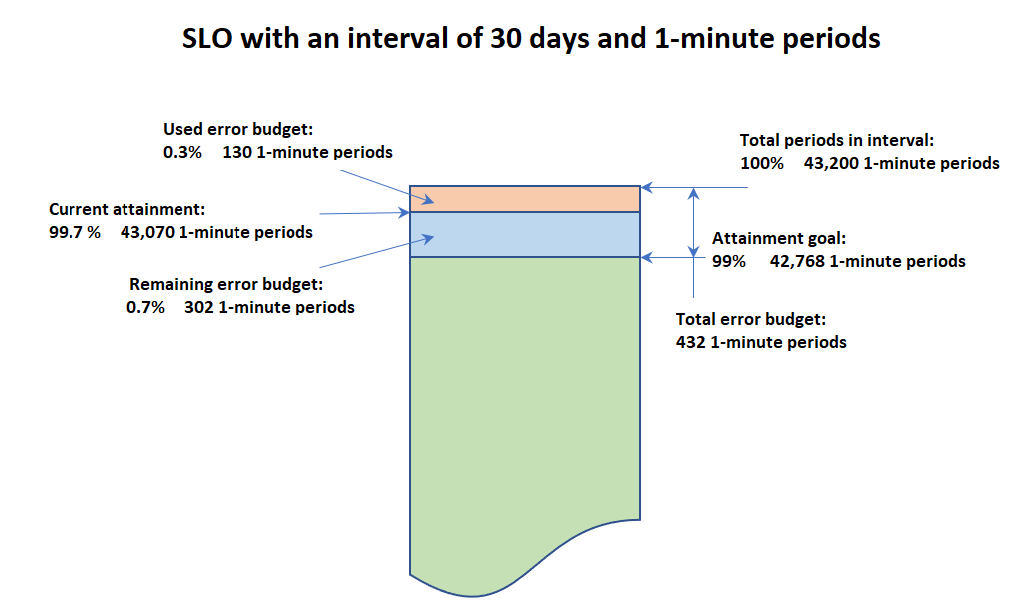
Set two burn rate alerts per SLO, not one. A fast-burn alert (around 10x your baseline error rate over a 1 to 2 hour window) pages you for acute outages, and a slow-burn alert (around 2x over 24 hours) catches the quiet degradation that would exhaust your monthly error budget without ever tripping a static threshold. That pairing is the whole point of burn rate alerts.
Static threshold alarms tell you a metric crossed a line. They do not tell you whether crossing that line matters to your users or your error budget. Burn rate alerting fixes that by measuring how fast you are spending the budget you agreed to, which is the only number that connects a page at 3am to a real commitment.
What a burn rate actually measures
Burn rate is a normalized speed. It answers one question: at the current error rate, how quickly am I consuming the error budget for my compliance period?
The AWS definition is the clearest to reason about. <cite index="4-2">The burn rate equals the error rate over the look-back window divided by (100% minus the attainment goal).</cite> So for a 99.9% availability target, the budget is 0.1%. If your error rate over the look-back window is 1%, the burn rate is 1% / 0.1% = 10. You are burning budget ten times faster than the rate that would exactly use it up over the full period.
The normalization is what makes the number portable. <cite index="2-14">A burn rate greater than one means that if the measured error rate is sustained over any future compliance period, the service will be out of SLO for that period.</cite> A burn rate of exactly one spends the budget precisely at the deadline. Anything below one and you finish the period with budget to spare.
Two consequences follow. First, a burn rate alert is self-scaling: it means the same thing for a 99.9% target as for a 99.99% target, unlike a raw error-count threshold. Second, the alert is only as honest as the SLI underneath it. <cite index="3-6">Burn rate alerting grounds pages in customer pain, the violation of an SLO, rather than in an unbounded set of infrastructure metrics.</cite> If your SLI does not track something a user feels, a perfectly tuned burn rate alert still pages you for nothing.
Fast burn and slow burn: the two alerts you need
The reason one alert is never enough is a tension between speed and noise. A short window with a high multiplier catches a hard outage in minutes but ignores a slow leak. A long window with a low multiplier catches the leak but reacts too slowly to a real incident. You want both, running at once.
<cite index="4-4">This is exactly the failure mode AWS describes as a slow burn: a persistent, low-level latency increase over several weeks that stays below the paging threshold and never fires a conventional alarm.</cite> A static alert cannot see it because no single sample is bad enough. A slow-burn alert integrates over a long window and catches the accumulated damage.
Google publishes concrete starting points for both alerts. <cite index="2-4">A good starting point for a fast-burn threshold is 10x the baseline with a short, one- or two-hour, lookback period.</cite> <cite index="2-16">A good starting point for a slow-burn threshold is 2x the baseline with a 24-hour lookback period.</cite> The slow-burn threshold is set only a little above ideal on purpose: <cite index="2-6,2-7">a short lookback with a high threshold generates too many alerts, but consumption that stays even a little too high for a long time eventually consumes the entire budget.</cite>
| Alert | Burn rate (starting point) | Window | What it catches | Response |
|---|---|---|---|---|
| Fast burn | ~10x baseline | 1 to 2 hours | Acute outage, sharp error spike | Page, investigate now |
| Slow burn | ~2x baseline | 24 hours | Quiet, sustained degradation | Ticket or low-urgency page |
Treat these as defaults to tune, not law. A service with low overnight traffic will see the burn rate swing wildly during quiet hours because a handful of errors move the ratio a lot.
Setting up burn rate alerts on Google Cloud
On Google Cloud you build the SLO first in Cloud Monitoring, then attach an alerting policy that reads the burn rate metric. <cite index="2-13">The burn-rate metric is retrieved by the time-series selector select_slo_burn_rate.</cite> You define one condition for the fast-burn alert and a second for the slow-burn alert, then combine them in one policy or run them as two.
There is a hard constraint to design around. <cite index="2-9,2-10">The lookback period is also used as the compliance period for calculating SLO performance, and you cannot base a burn-rate alert on a compliance period longer than 24 hours.</cite> So even if your SLO is a 30-day rolling window, your alert approximates it with a window of 24 hours or less. <cite index="2-11">In most cases, approximating a 28- or 30-day compliance period with a window under 24 hours is enough to detect outages and drive short-term response.</cite>
Watch the low-traffic trap explicitly. <cite index="2-12">Large swings in traffic and error rates over a day can make alerting overly sensitive during low-traffic periods, so consider a burn-rate threshold significantly larger than one to reduce that sensitivity.</cite> In practice that means either raising the multiplier or requiring a minimum request count before the condition can fire.
Setting up burn rate alerts on AWS
On AWS the equivalent is CloudWatch Application Signals SLOs. You define an SLO, then attach burn rate alarms to it. <cite index="4-1">To calculate the burn rate you must specify a look-back window, the time duration over which the error rate is measured.</cite>
For the fast-plus-slow pairing on shorter SLOs, AWS gives a specific recipe. <cite index="4-5,4-6">For SLOs with an interval shorter than three hours, start with one pair of burn rate alarms where one alarm's look-back window is one twelfth of the other's, then set a composite alarm on the pair.</cite> The composite alarm is what you page on, so a transient blip on the short window alone does not wake anyone.
A couple of setup details save time. <cite index="4-8">The first time you create an SLO in an account, CloudWatch creates the AWSServiceRoleForCloudWatchApplicationSignals service-linked role, which lets it read Logs, X-Ray traces, metrics, and tagging data.</cite> And you are not limited to the built-ins: <cite index="4-7">CloudWatch recommends both latency and availability SLOs on critical applications, and you can set an SLO on any CloudWatch metric or metric-math expression that resolves to a single time series.</cite> Alarms notify through an SNS topic you select or create at SLO time.
# AWS burn rate, the number your alarm compares against a threshold
burn_rate = error_rate_over_lookback / (1 - attainment_goal)

# 99.9% target, 1% errors over the window
#   = 0.01 / 0.001 = 10   -> fast-burn territory, page
What to check before you turn any of this on
Do not add burn rate alerts to a service that does not yet have an SLO worth alerting on. Fix these first.
You have an SLI that maps to user experience
Confirm the SLI counts good versus total events in a way a user would recognize, availability, latency below a threshold, or correctness. Alerting on a burn rate computed from a meaningless ratio just moves the noise.
You picked the right window type and target
<cite index="3-2">A rolling 30-day window tracks user experience more closely, while a calendar window aligns monitoring with business planning cycles.</cite> Pick deliberately, because it changes when the budget resets and therefore when a slow-burn alert clears.
You have a plan to revisit the numbers
SLOs are not set once. <cite index="3-4">Review your SLOs every six to twelve months to confirm they still match user expectations and business needs.</cite> Burn rate thresholds inherit that cadence: retune the multipliers after you have seen a few real incidents and a few false pages.
You are using this to prove a migration did not regress reliability
This is where burn rate alerts pay off during a move. Stand up the SLO and both alerts on the source system before you touch anything, so you have a baseline burn rate under normal load. After cutover, the same alerts tell you within an hour whether the new environment is spending budget faster than the old one. If you are planning that kind of before-and-after on a datacentre exit or database move, define the SLOs in the discovery phase, not the week of the cutover. Standing up sustainable SLOs, alerting and on-call is a separate workstream from the migration mechanics, and treating it as one keeps the cutover boring.
The trade-off, and what it costs later
Burn rate alerting buys you fewer, more meaningful pages. The cost is up front and ongoing: you have to define good SLIs, maintain SLOs, and accept that the alert now depends on a whole measurement pipeline rather than a single CloudWatch metric.
The failure mode to plan for is a broken or delayed SLI feeding the burn rate. If ingestion stalls, the burn rate can read low or go stale, and a slow-burn alert can sit quiet through a real problem. Alarm on data freshness alongside the burn rate, and keep at least one blunt availability alarm as a backstop while you gain confidence. The reward for that discipline is an on-call rotation that gets paged for things that are actually burning budget, and left alone for things that are not.
Frequently asked questions
What is a good burn rate alert threshold to start with?
Two alerts. Google recommends roughly <cite index="2-4,2-16">10x the baseline over a one- or two-hour window for fast burn, and 2x the baseline over a 24-hour window for slow burn.</cite> Treat these as defaults, then tune the multipliers after you have observed a few real incidents on your own traffic pattern.
How is burn rate calculated?
<cite index="4-2">Burn rate equals the error rate over the look-back window divided by (100% minus the attainment goal).</cite> <cite index="2-14">It is normalized so that a value above one means the service will miss its SLO if that error rate is sustained over a future compliance period.</cite> A burn rate of ten means you are spending budget ten times faster than the sustainable rate.
Why not just use a static CloudWatch or Cloud Monitoring alarm?
Static alarms fire on a metric crossing a line and cannot distinguish a brief blip from budget-threatening damage. They miss the slow case entirely: <cite index="4-4">a low-level latency increase over several weeks stays below the paging threshold and never alarms.</cite> A slow-burn alert integrates over a long window and catches exactly that.
Can I alert on a 30-day SLO directly on Google Cloud?
Not directly. <cite index="2-9,2-10">The lookback period doubles as the compliance period for the alert, and burn-rate alerts cannot use a compliance period longer than 24 hours.</cite> You approximate the long window with a shorter one, which <cite index="2-11">is usually sufficient for detecting outages and driving short-term response.</cite>
Do I need burn rate alerts on both latency and availability?
For critical services, yes. <cite index="4-7">AWS recommends setting both latency and availability SLOs on critical applications, and you can also define an SLO on any metric or metric-math expression that resolves to a single time series.</cite> Each SLO gets its own fast and slow burn pair.